
Please note whilst reading that the Jet Streams behaviour is a direct result of solar output NOT GW!
The article reads....
During March 2013, residents of Europe and the Southeast U.S. must have wondered what happened to global warming. Repeated bitter blasts of bitter cold air invaded from the Arctic, bringing one of the coldest and snowiest Marches on record for much of northern Europe. In the U.K., only one March since 1910 was colder (1962), and parts of Eastern Europe had their coldest March since 1952. A series of exceptional snowstorms struck many European locations, including the remarkable blizzard of March 11 - 12, which dumped up to 25 cm (10") of snow on the Channel Islands of Guernsey and Jersey in the U.K., and in the northern French provinces of Manche and Calvados. The entire Southeast U.S. experienced a top-ten coldest March on record, with several states experiencing a colder month than in January 2013. Despite all these remarkable cold weather events, global temperatures during March 2013 were the 9th warmest since 1880, said NASA. How, then, did such cold extremes occur in a month that was in the top 8% of warmest Marches in Earth's recorded history? The answer lies in the behaviour of the jet stream. This band of strong high-altitude winds marks the boundary between cold, polar air and warm, subtropical air. The jet stream, on average, blows west to east. But there are always large ripples in the jet, called planetary waves (or Rossby waves.) In the Northern Hemisphere, cold air from the polar regions spills southward into the U-shaped troughs of these ripples, and warm air is drawn northwards into the upside-down U-shaped ridges. If these ripples attain unusually high amplitude, a large amount of cold polar air will spill southwards into the mid-latitudes, causing unusual cold extremes. This was the case in Europe and the Eastern U.S. in March 2013. These cold extremes were offset by unusually warm conditions where the jet stream bulged northwards - over the Atlantic, the Western U.S., and in China during March 2013. In fact, the amplitude of the ripples in the jet stream reached their most extreme value ever recorded in any March during 2013, as measured by an index called the Arctic Oscillation (AO).
The monthly Arctic Oscillation (AO) index from 1950 - March 2013 shows that three of the six most extreme negative cases have occurred since 2009. Note that all of the six most negative AO indices on record were associated with historic cold waves and blizzards over Europe or the Eastern U.S. Image created using data from NOAA's Climate Prediction Center.
Measuring the jet stream's contortions: the Arctic Oscillation (AO)
One measure of how extreme the ripples in the jet stream are is by measuring the difference in pressure between the Icelandic Low and the Azores High. An index based in this pressure difference is called the North Atlantic Oscillation (NAO). When this index is strongly negative, it means that the pressure difference between the Icelandic Low and the Azores High is low. This results in a weaker jet stream, allowing it to take large, meandering loops. These loops allow cold air to spill far to the south from the Arctic into the mid-latitudes. A more general index that looks at pressure patterns over the entire Arctic, not just the North Atlantic, is called the Arctic Oscillation (AO). The AO and NAO are closely related about 90% of the time. According to a 2010 paper by L'Heureux et al., a strongly negative AO pattern that allows cold air to spill southwards into the mid-latitudes does nothing to the average temperature of the planet. Fluctuations in the jet stream as measured by the AO simply act to redistribute heat. It's kind of like turning off your refrigerator and leaving the refrigerator door open - the cold air from the refrigerator spills out into the room, but is replaced inside the refrigerator by warm room air. No net change in heat occurs. During March 2013, the AO index hit -3.2. Not only was this the most extreme negative March value of the AO since record keeping began in 1950, it was also the sixth lowest AO index ever measured. It was also the first time the AO index had been that extremely negative in a non-winter month (because the circulation patterns are stronger in the winter, we tend to see more extreme values of the AO index in December, January, and February.) This unusual contortion of the jet stream in March 2013 allowed Europe to have exceptional cold weather in a month when the global average temperature was among the warmest 8% of Marches on record. Why did the AO index get so extreme in March 2013? Part of the blame goes to the sudden stratospheric warming event that began in January (wunderblogger Lee Grenci has a detailed post on this event.) Sudden stratospheric warming events tend to push the atmosphere into a more negative AO configuration. Another major factor was the very active Madden Julian Oscillation (MJO), a pattern of increased thunderstorm activity near the Equator that moves around the globe in 30 - 60 days. When the area of increased thunderstorms associated with the MJO is located in the Pacific Ocean, as occurred during much of March 2013, this tends to create negative AO conditions. Finally, wintertime Arctic sea ice loss has been tied to more negative AO patterns, and sea ice was well blow average again during March.
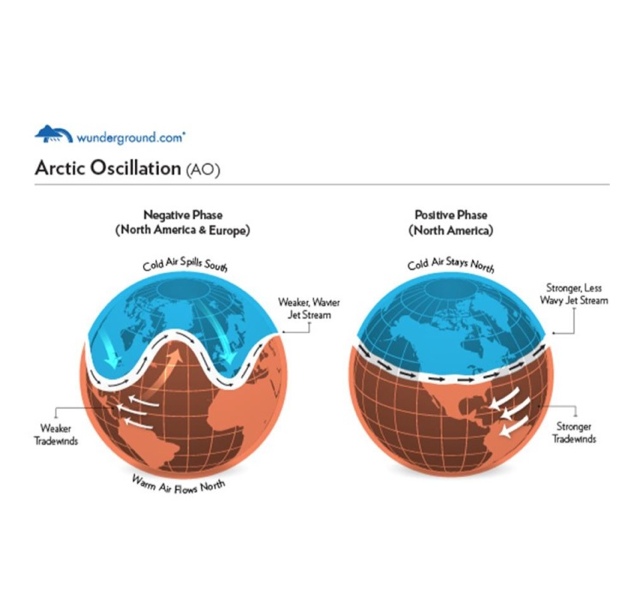
The Arctic Oscillation (AO) is a pattern of varying pressure and winds over the Northern Hemisphere that can strongly influence mid-latitude weather patterns. When the AO is in its positive phase, jet stream winds are strong and the jet stream tends to blow mostly west to east, with low-amplitude waves (troughs and ridges.) Since the jet stream marks the boundary between cold Arctic air to the north and warm subtropical air to the south, cold air stays bottled up in the Arctic. When the AO is in its negative phase, the winds of the jet stream slow down, allowing the jet to take on more wavy pattern with high-amplitude troughs and ridges. High amplitude troughs typically set up over the Eastern U.S. and Western Europe during negative AO episodes, allowing cold air to spill southwards in those regions and create unusally cold weather.
Are jet stream patterns getting more extreme?
We've had some wildly variable jet stream patterns in recent years in the Northern Hemisphere. Just last year, we had a strongly positive AO in March, when our ridiculous "Summer in March" heat wave brought the warmest March on record to the U.S. The first day of spring in Chicago, IL on March 20, 2013 had a high temperature of just 25°F - a 60 degree difference from last year's high of 85°F on March 20! During the past five years, we've set new monthly records for extreme negative AO index for six of the twelve months of the year:
-4.3: February 2010
-3.4: December 2009
-3.2: March 2013
-1.5: October 2009, 2012
-1.4: June 2009
-1.4: July 2009
Note that four of these months with an extremely negative AO occurred in one year - 2009. This unusual event was "unprecedented in the 60-year record", according to L'Heureux et al. (2010.) Despite the unusually large negative AO in 2009, the authors found that the AO index between 1950 - 2009 had actually trended to be more positive, in both the winter and annual mean. This is in agreement with what many climate models predict: the AO index should get increasingly positive, due to increasing levels of CO2 in the atmosphere, since this tends to make the stratosphere cool and increase the strength of high altitude winds over the Arctic. However, a number of papers have been published since 2009 theorizing that the record loss of Arctic sea ice in recent years may be significantly altering Northern Hemisphere jet stream patterns. Many of these studies show a link between Arctic sea ice loss and an increasingly negative AO and NAO index in winter. Dr. Jennifer Francis of Rutgers has authored several of these papers, and wrote a very readable explanation of the theory linking Arctic sea ice loss to extreme weather in the mid-latitudes for our Earth Day 2013 microsite. Her post was called, "The Changing Face of Mother Nature." The most recent technical paper connecting Arctic sea ice loss to extreme weather was a March 2013 paper by Tang et al., "Cold winter extremes in northern continents linked to Arctic sea ice loss". The paper argued that unusual jet stream contortions in winter have become increasingly common in recent years. The scientists found a mathematical relationship between wintertime Arctic sea ice loss and the increase in unusual jet stream patterns capable of bringing cold, snowy weather to the Eastern U.S., Western Europe, and East Asia, typical of what one sees during a strongly negative Arctic Oscillation. They theorized that sea ice loss in the Arctic promotes more evaporation, resulting in earlier snowfall in Siberia and other Arctic lands. The earlier snow insulates the soil, allowing the land to cool more rapidly. This results in a southwards shift of the jet stream and builds higher atmospheric pressures farther to the south, which increases the odds of cold spells and blocking high pressure systems that can cause extended periods of unusually cold and snowy weather in the mid-latitudes. The research linking climate change impacts in the Arctic to more extreme jet stream patterns is still very new, and we need several more years of data and additional research before we can be confident that this is occurring. But if the new research is correct, the crazy winter weather we've been seeing since 2009 may be the new normal in a world with rapid warming occurring in the Arctic.
No comments:
Post a Comment